CoBE Tool: How to Use
There are two ways to enter data into the CoBE v.2 tool— directly into the webpage or using the template spreadsheet. The webpage is a clear and convenient format for entering relatively small amounts of data, while the spreadsheet works better for larger amounts of data or data already in spreadsheet format. This walkthrough will describe each process.

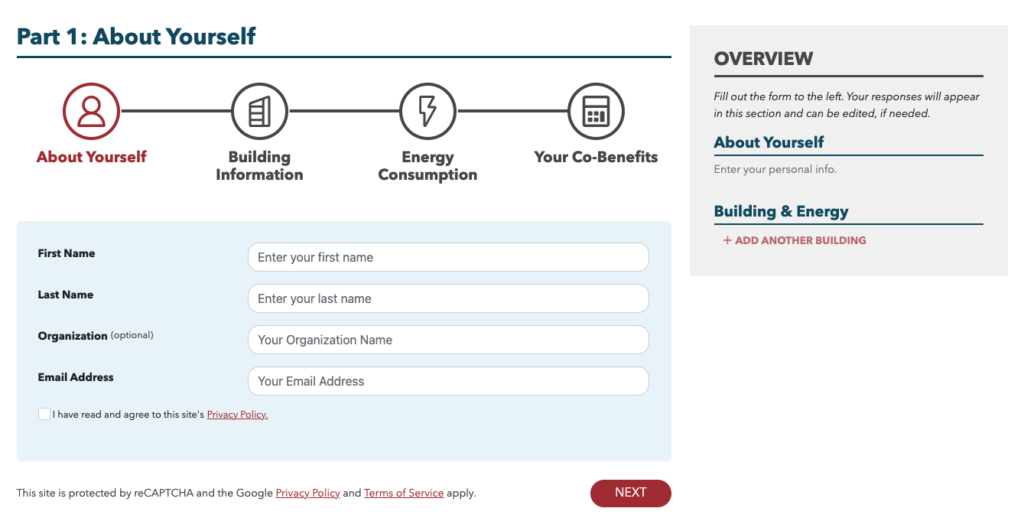
After clicking the button, you will be brought to the “About Yourself” section. You will be prompted to enter some personal information, and to read and agree to the privacy policy. (Note that as you enter information throughout the entire process, it will appear in the “Overview” box, from which you can choose to make edits.)
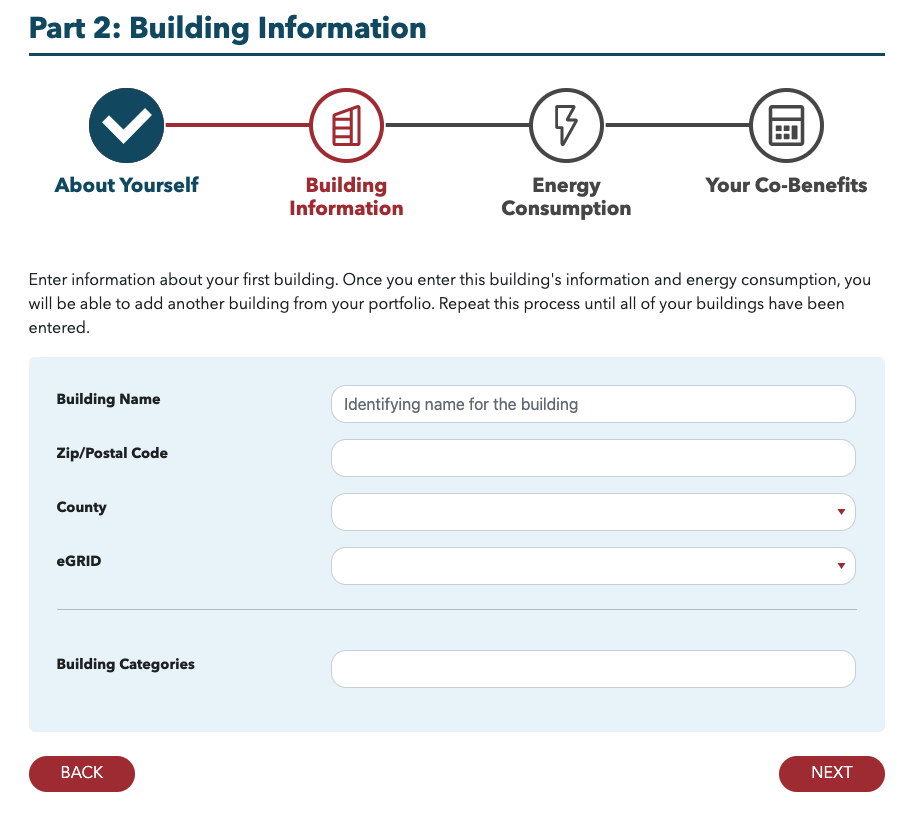
Once you have completed the “About Yourself” section, click “NEXT” in the bottom right, and you will be brought to the “Building Information” section. Here you will be prompted to enter some basic information about the first building that you are reporting for, including a building name, the ZIP code, county, eGRID region, and a building category. If your building has multiple distinct subsections, and each subsection has a different category, you may enter multiple building categories. In this example, the building described has two distinct subsections: one is an office, and the other falls under the category “Entertainment/public assembly”.
The building name will just be used in the CoBE results page, and does not need to match any official building name. A list of eGRID regions can be found here. If you are unsure which category to select, you can reference this ENERGY STAR resource. For guidance on whether or not to give your building multiple categories, see the ENERGY STAR FAQ on when to create separate property uses for one building.
Next, you will be prompted to enter information about the building’s energy consumption. If you selected multiple categories in the previous section because your building has multiple subsections, then you will be asked to enter information for each subsection.
If you want to enter more than one energy source, or if you want to enter data for more than one year, you must click the plus symbol in the bottom right corner of the category. In this example, the user is entering data for both 2020 and 2021. The user is reporting two different energy sources for the “Entertainment/public assembly” section of their building. Finally, for the “Office” subsection they are reporting district chilled water. Thus, the user has eight distinct energy source sections. For the “Entertainment/public assembly” subsection, the user is reporting electricity in 2020, natural gas in 2020, electricity in 2021, and natural gas in 2021. For the “Office” subsection, the user is reporting chilled water in 2020, chilled water in 2021, electricity in 2020, and electricity in 2021.
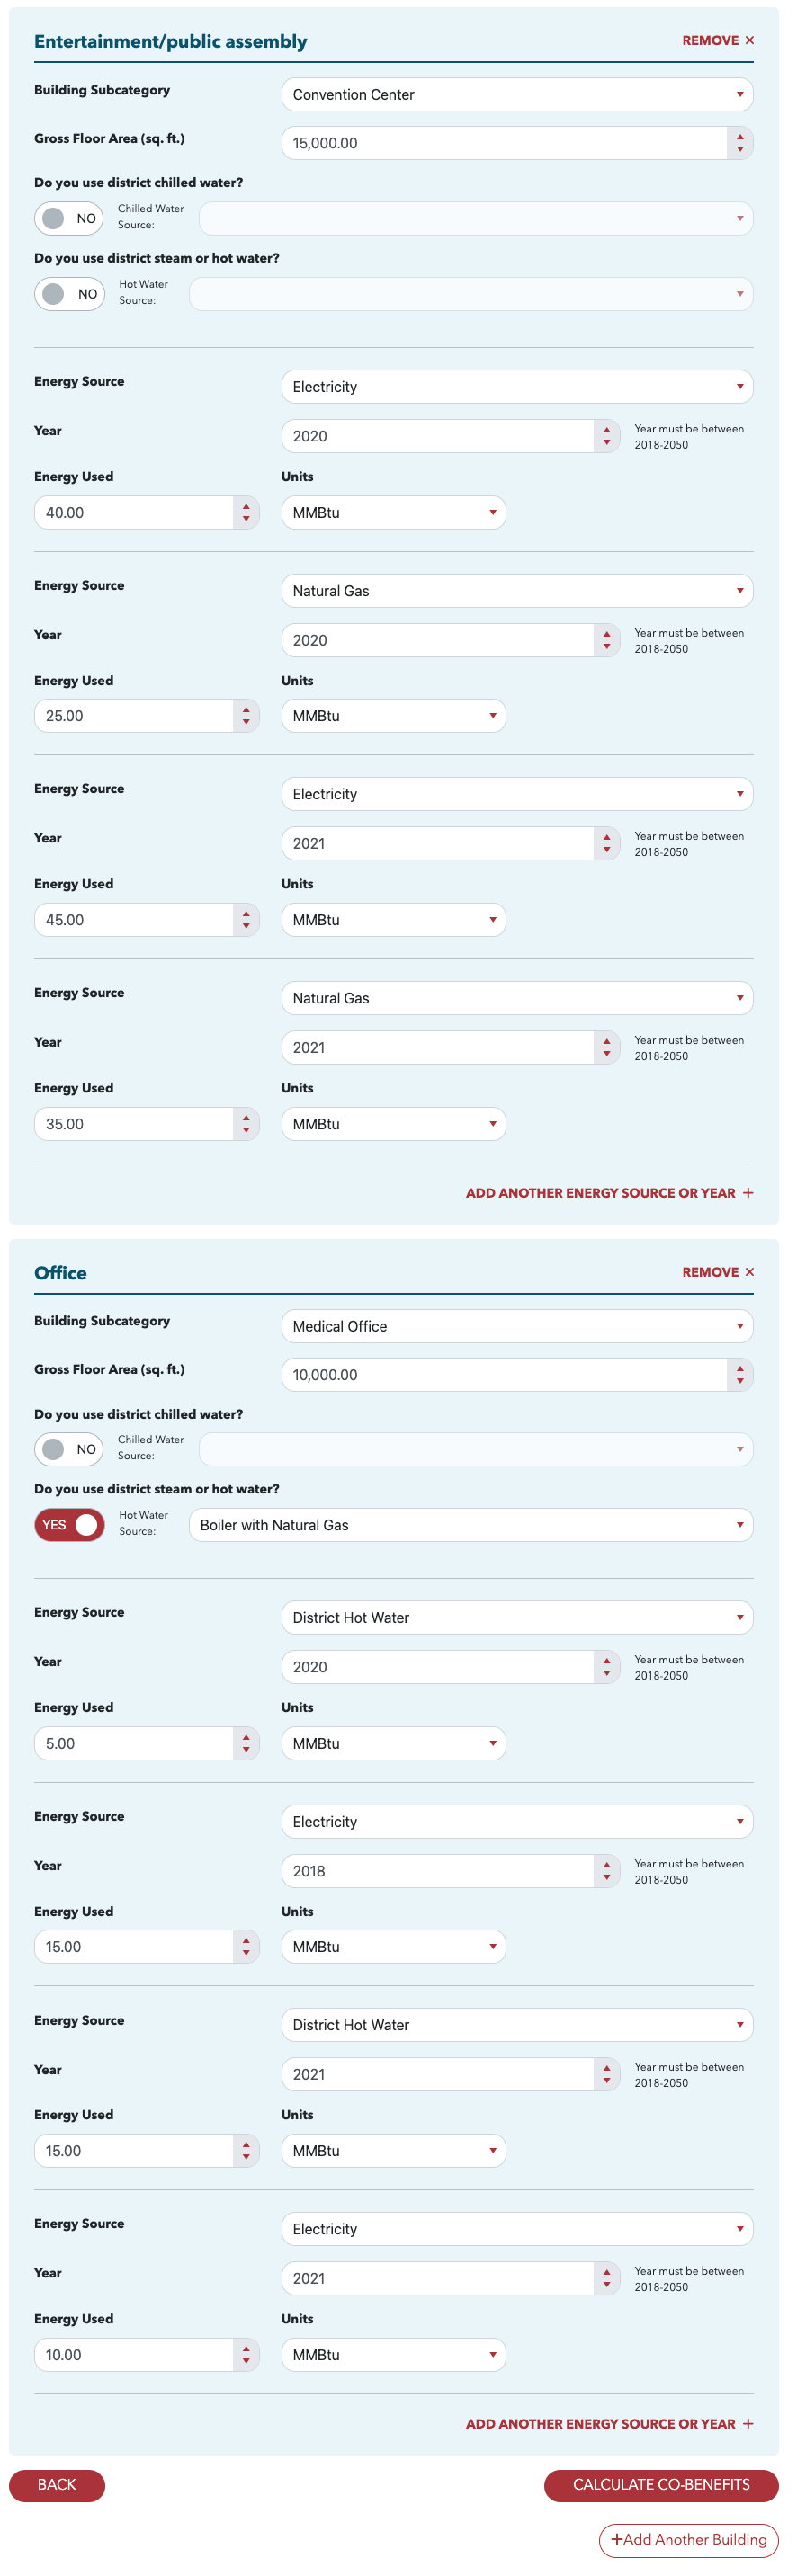
Finally, you can choose to enter data for another building by clicking on “Add Another Building” in the lower right, or you can click “CALCULATE CO-BENEFITS” if you are done entering data.
Spreadsheet Entry
If instead you would like to use the template spreadsheet to enter data, select “Use Spreadsheet.”
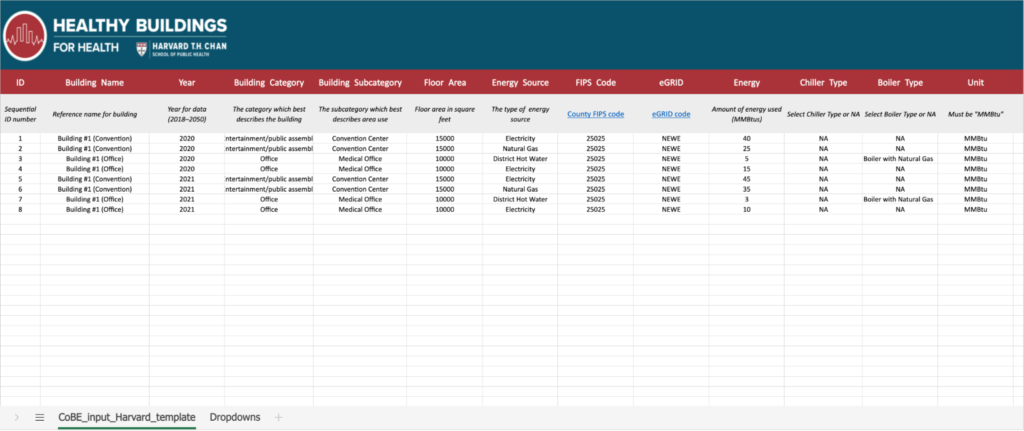
You will be brought to a page where you can upload your data. At the top, click “Download Spreadsheet” to download the template spreadsheet to your local device as a .xlsx file. The sheet comes pre-filled with example rows. It also has a tab containing a data dictionary with more information about data entry for each column (not shown in image), and a tab with the dropdown values for the cells which have dropdowns.

Each building should get at least one row. Different subsections of the building should each get their own row, as should different energy sources within each subsection, as should different years being reported. Also, if applicable, district hot water/steam and district chilled water each be reported in their own rows for each subsection.
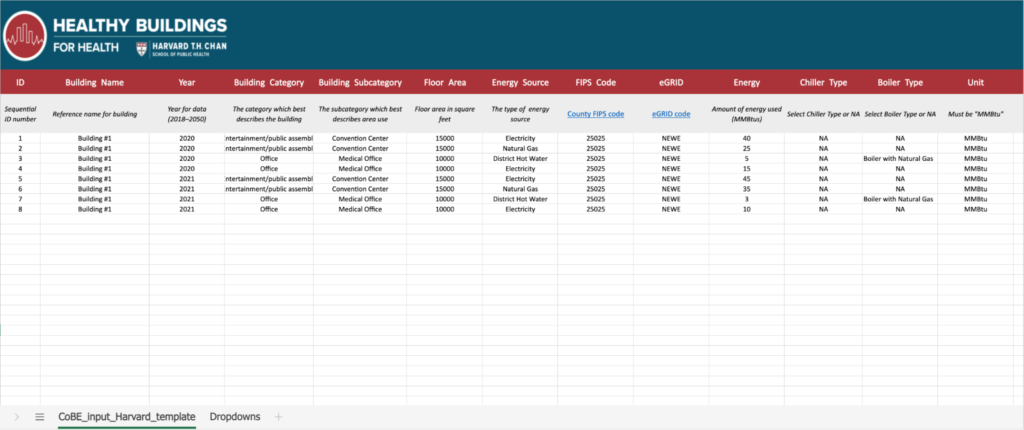
Note that if you want to be able to filter your results by building subsection rather than by entire building, you could give each subcategory a distinct building name, as shown below. This will not affect the results of your entire portfolio, but when you filter by building in the CoBE Results page, it will allow you to see the individual impacts of your building subsections, rather than just the impact of an entire building.
If you have any questions about the CoBE tool and how to use it, please contact Brian Sousa, Research Data Analyst at Boston University School of Public Health: sousab@bu.edu.